Comparing Returns
Your financial journey involves accumulating assets (which we will also refer to as investment in this write-up) and letting them grow. But how do you compare the returns (the money it makes for you) of your assets? Consider these two investments.
- You invested
$1000and got$1100a year later. - You invested
$1000and got$1200a year later.
It's straightforward. Investment that gave you more money, did better.
Here is another simple case.
- You invest
$1000and get$1100a year later. - You invest
$1000and get$1100after 6 months.
With the second investment, you can reinvest the $1100 for another 6 months, and
make more money than first case. It's clearly better than the first investment.
Now, consider these two investments:
- Investment A: Invest
$8,000→ get$10,400after1.8 years - Investment B: Invest
$12,000→ get$15,000after2.5 years
This one is not as straightforward as the previous examples. We can't compare
them directly, because both investment periods and initial investments are
different. Even in these cases with two transactions, where money comes in once,
and goes out one (initial investment and final payout), calculating the return
rate is straightforward: divide the total return by the time period. For
Investment A, the annual return rate is roughly 16%
((10,400-8,000)/8,000 ÷ 1.8 years). For Investment B it's 10%
((15,000-12,000)/12,000 ÷ 2.5 years).
But if you have multiple transactions on an asset, these simple methods don't work. That's when Extended Internal Rate of Return (XIRR) as a measure becomes important.
XIRR
XIRR provides an annualized return rate that accounts for the timing of all cashflows - periodic investments, partial withdrawals, dividends, or irregular transactions.
Let's explore how XIRR works when investments involve multiple transactions over time. For that, we first look at cashflow.
Cashflow
A cashflow is any movement of money into or out of an asset. Each cashflow has a date, an amount, and direction of flow. Into asset (called inflow), and out of asset (called outflow).
In the cases above we had two cashflows, money comes in once, and goes out once. Real investments often involve more than one cashflow: periodic deposits, partial withdrawals, dividends, and so on. When you have multiple inflows and outflows at different points in time. All you have to do is to collect these with -ve sign for inflow and +ive sign for outflow. Put them in excel sheet, and pass them to XIRR function.
Let's consider an example. Let's say you bought some units of Fesla stock, twice. Got dividend once, and then sold all the units. Here are the cashflows listed, with their dates, and sign as discussed above.
| Dates | Cashflows |
|---|---|
| 2024-01-01 | -10000 |
| 2024-06-01 | -5500 |
| 2024-12-15 | 500 |
| 2025-05-20 | 17250 |
To calculate XIRR, use the formulae =XIRR(CashFlows, Dates), where Cashflows
is the range of cashflow column, and Dates is the range of dates column.
So, all you have to do, is to collect all the cashflows related to an asset, and run them through XIRR function. This is straight forward, except for the issue that in double entry, sometimes the transactions related to an asset, might be spread across accounts.
XIRR in FinBodhi
Let's convert the stock example above to double-entry transactions.
Let's break down the transactions. In the first transaction, you buy 10 Fesla
stocks at $1000 each, costing you $10,000. In the next transaction, you buy 5
stocks for $1100. Next, you get a dividend from the company. And in the last
transaction you sell the stocks for $1150.
This example demonstrates the two ways your assets bring value.
- For commodity assets, their underlying price might change. I.e. Fesla went
from
$1000to$1150. - You might receive income, based on the underlying asset. I.e. Dividend for the stocks you held.
XIRR is calculated for an account. In the example above, that would be Asset:Fesla. Commodity price changes for calculating returns are automatically taken care of by FinBodhi. For income from assets, if those transaction happen with the asset account, FinBodhi will take care of it.
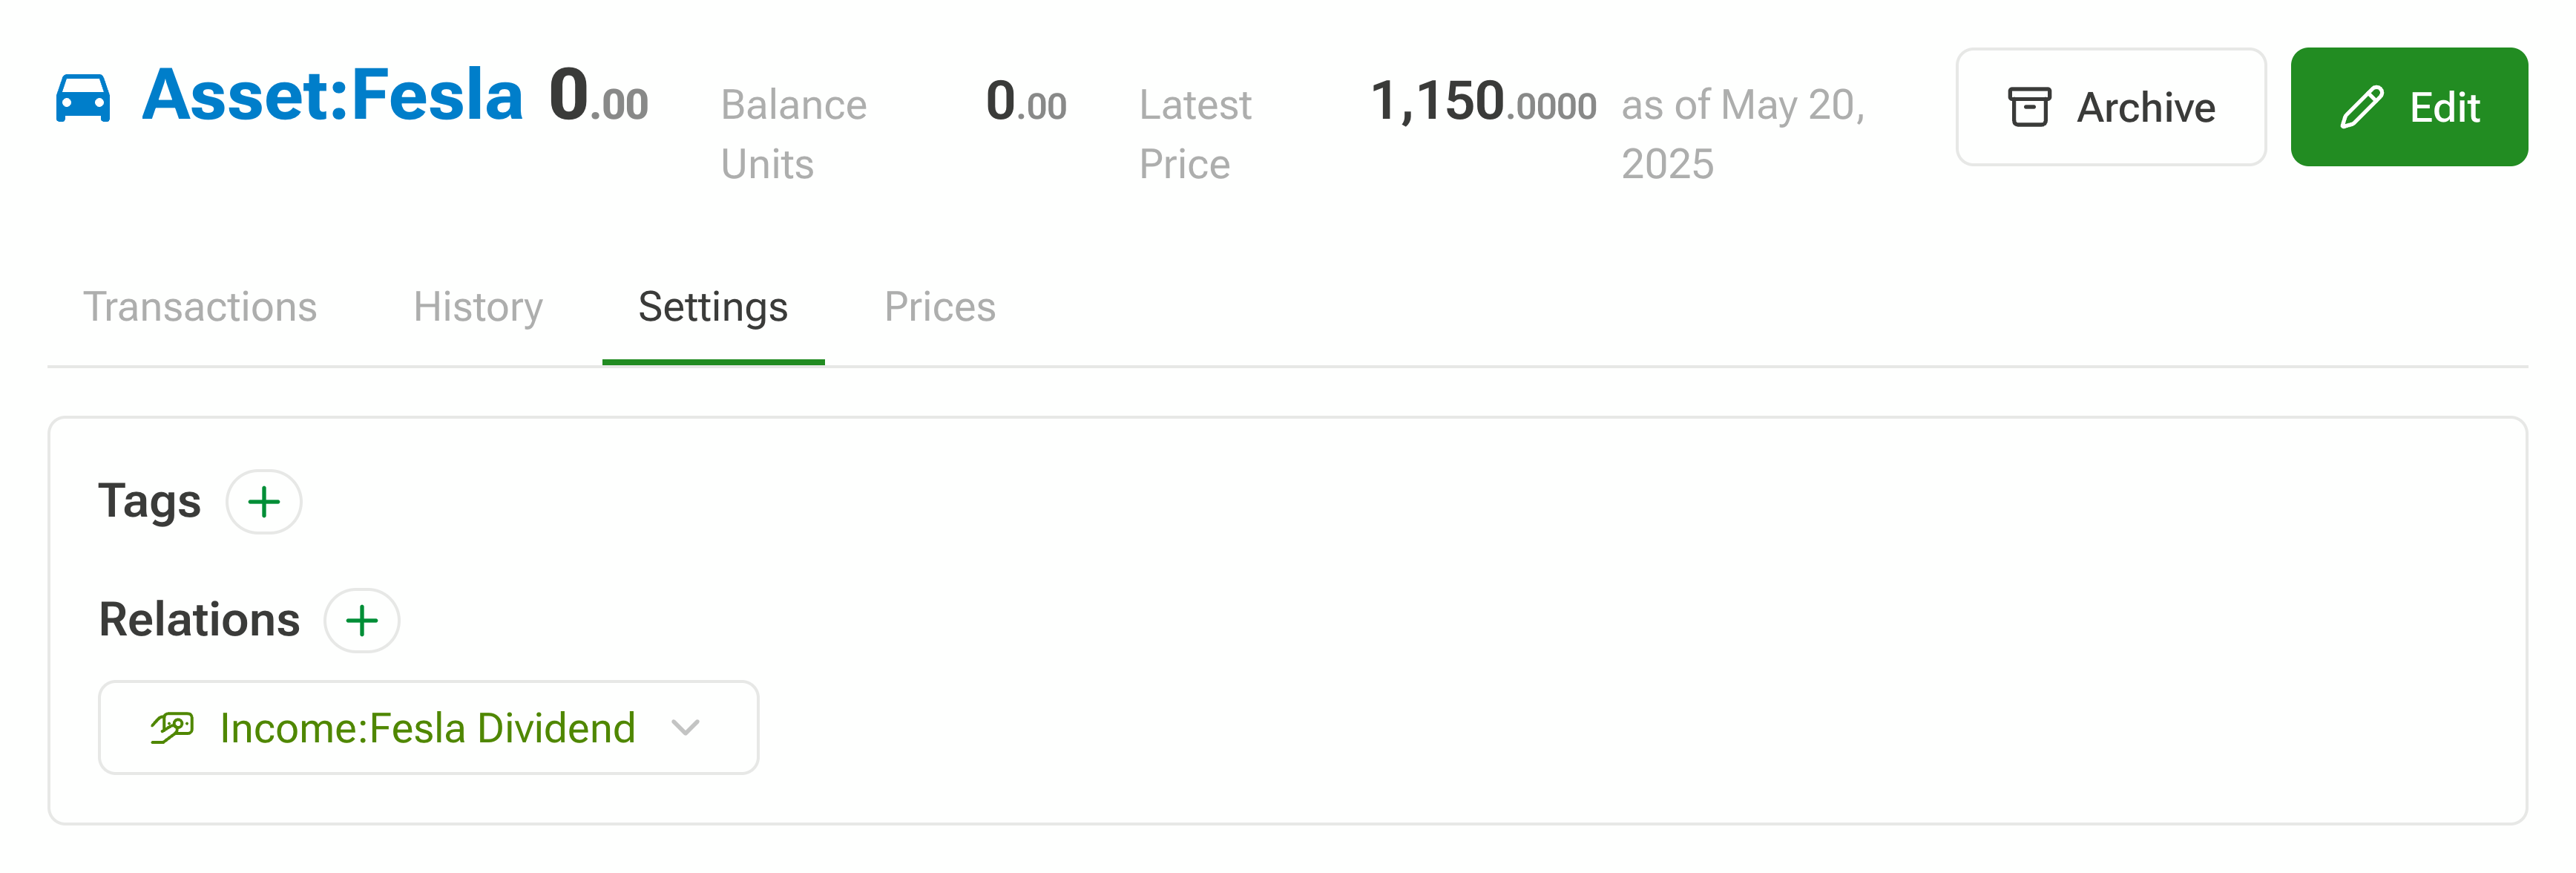
Account Relations
But if it happens with another account (like in the example above, where the income was received in Asset:Bank.), then you have to point that out to FinBodhi. You do this by adding relation between the accounts, in account settings. In other words, prices capture asset value changes. If the value of the asset changes for any other reason, you should use related accounts to include the transactions from related Income/Expense accounts. Let's go through it step by step. First, let's look at XIRR. Without relating accounts, the cashflows would look like:
| Dates | Cashflows |
|---|---|
| 2024-01-01 | -10000 |
| 2024-06-01 | -5500 |
| 2025-05-20 | 17250 |
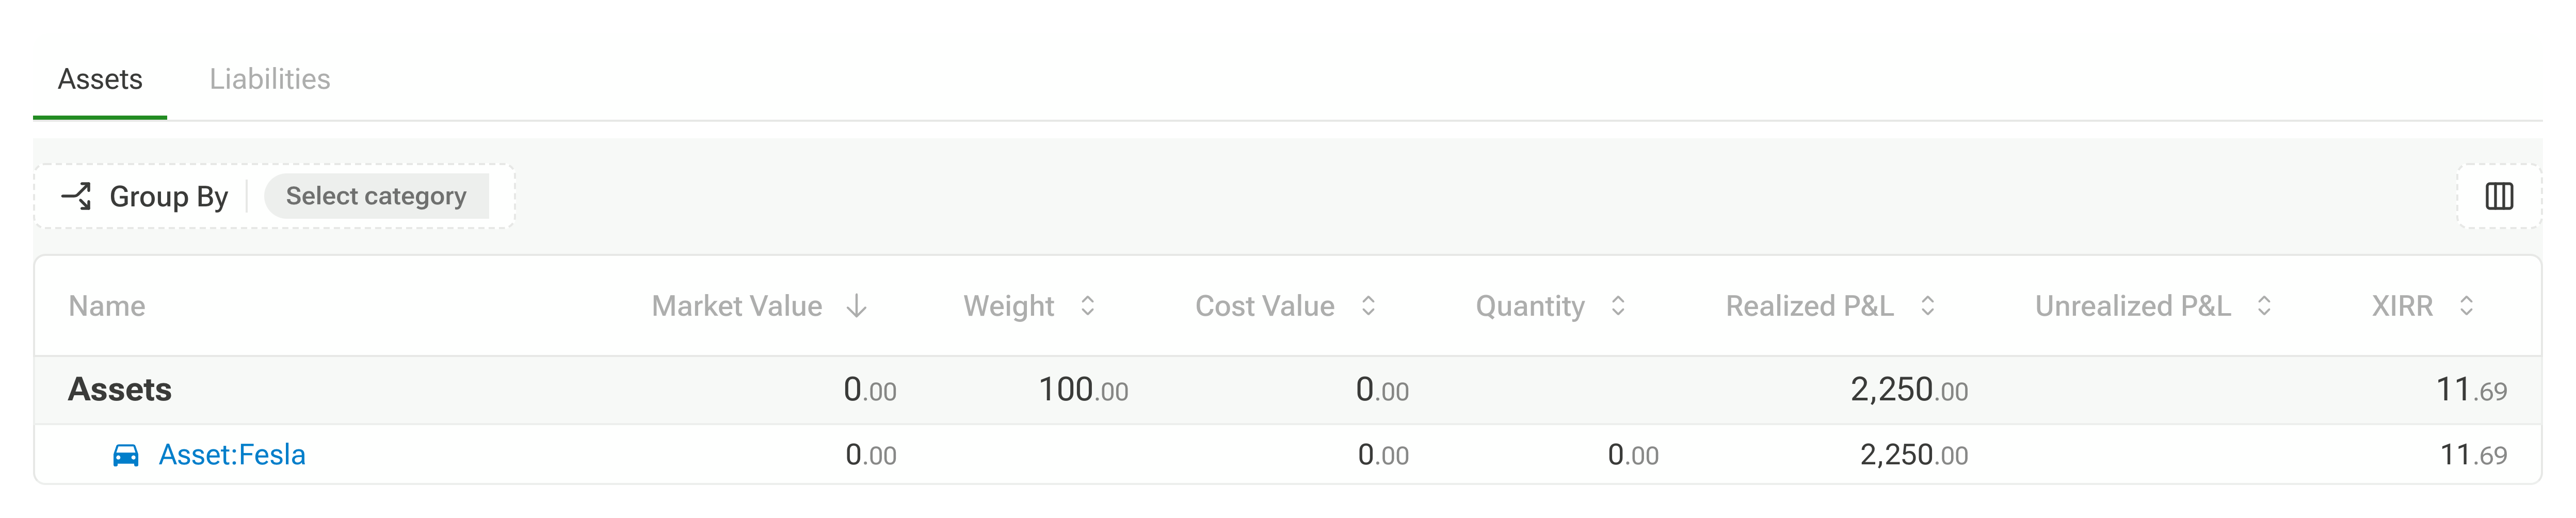
It only includes transactions to/from the Asset:Fesla account. XIRR calculated with these cashflows is shown in the balance page screenshot below.

It doesn't include income from Income:Fesla Dividend. To fix this, add Income:Fesla Dividend as relation to Asset:Fesla.
Now, with the relation, here is the updated balance sheet.
Conclusion
Double-entry account keeps track of the flow of money. But sometimes, to calculate the return rate you might have to define relations between accounts.